MunchiesSNHU
Food Waste Tracker
MunchiesSNHU is SNHU's campus-wide food waste tracking platform — built to help staff and students reduce food waste, increase composting, and make sustainability measurable.
Every dining hall, student center, and campus location generates food waste. MunchiesSNHU gives staff the tools to measure it, track it, and reduce it — and gives students the insight to understand their impact.
Live dashboards show diversion rates, bin fullness, compost volume, and week-over-week trends across every location on campus.
Track how much food is composted versus discarded, and watch the campus diversion rate improve over time toward the 50% goal.
Students can view their impact, set personal pledge goals, and see how their campus ranks on the sustainability leaderboard.
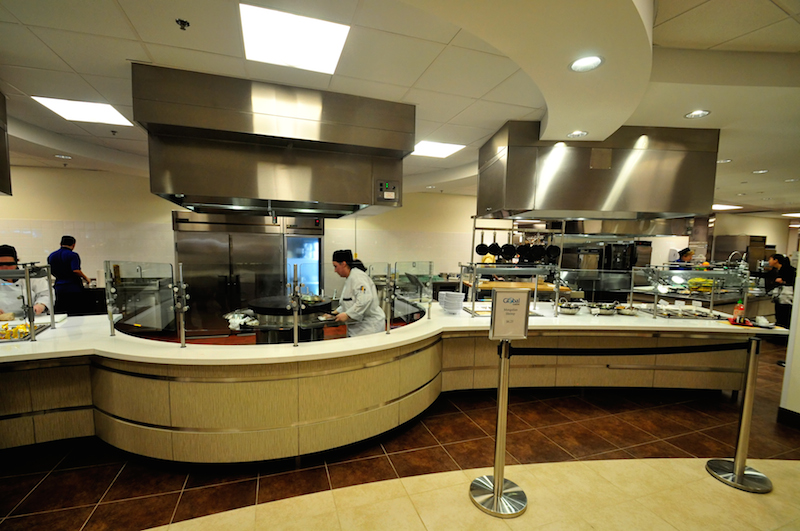
Built for both staff and students, with role-based dashboards that surface the right information to the right people.
Staff log food waste by weight, location, food type, and sensor readings — including temperature, pH, humidity, bin fullness, and gas levels.
Real-time charts show daily waste vs. compost, diversion rate trends, top waste locations, and week-over-week comparisons — no refresh needed.
An AI chatbot with live access to campus data answers questions about waste stats, composting best practices, and what to focus on next.
Staff can upload entire weeks of data at once using a structured CSV template — with row-level validation and a preview before anything is saved.
Campus locations are ranked by diversion rate, giving dining teams and student organizations something to compete for — in a good way.
Generate filtered reports for any date range, status, or location — then export to CSV for presentations, audits, or sustainability meetings.
The workflow connects data collection to insight in three straightforward steps.
After each meal service, staff enter food waste data — weight, location, food type, sensor readings — or upload it in bulk via CSV.
The platform computes diversion rates, flags high-priority pickup locations, and identifies trends across days, weeks, and locations.
Staff use reports to adjust operations. Students use the dashboard to set pledge goals, track campus impact, and engage with sustainability.
Create an account to access the dashboard built for your role — staff or student.